Ethereum Technical Analysis: Trading The Charts

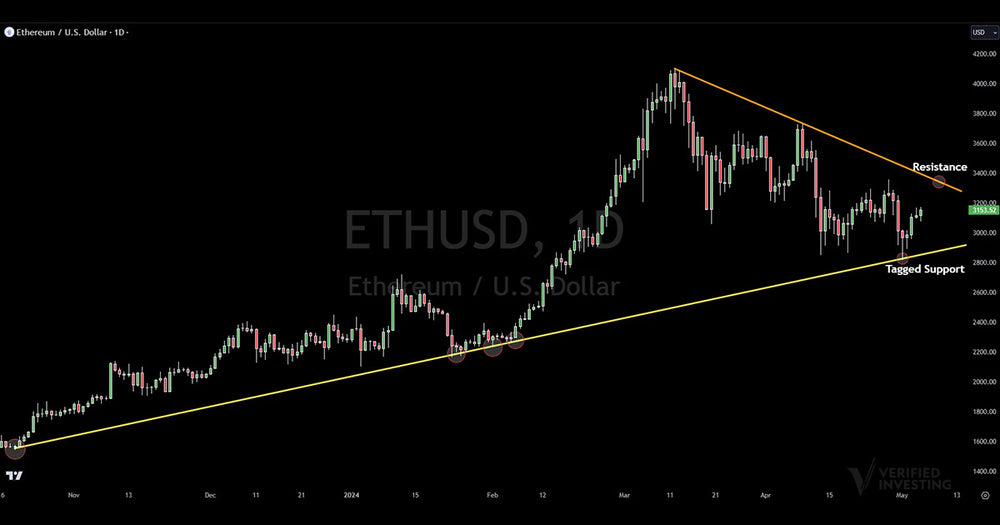
Ethereum has fallen 23% off its March 2024 highs. However, it did find major support at its low on May 1st, 2024. This level tagged a trend line that goes back to the beginning of the bull run in October 2023 when Ethereum was below $1,600. The same trend line connects perfectly through the lows of January and February 2024 right to the recent low on May 1st, 2024. This gives technical traders a major support level to follow.
Now that we have isolated down our support trend line, lets look at resistance. Since support has been tagged, the likely scenario is that price on Ethereum will move higher until it hits resistance. The resistance level can be easily found by taking the 52 week high in March 2024 at $4,100 and connecting it to the secondary pivot high on April 9th, 2024. This means the current resistance on Ethereum is between $3,300-$3,400.
The overall pattern is what is called a wedge pattern in technical analysis. Investors will need to see which direction price breaks. Whichever way it breaks, a big move is likely to follow.