Pro Charts: Crypto
Technical Analysis On Bitcoin: Inside The Charts
Updated: May 06, 2024 | Published: May 05, 2024

By Verified Investing
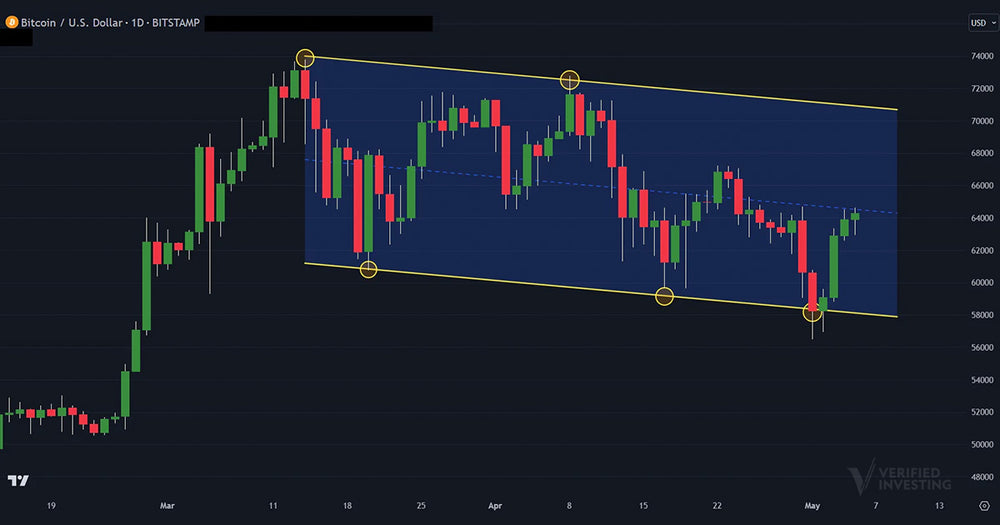
Bitcoin continues to bounce up and down inside a bigger parallel channel that starts at the all-time highs.
Just last week, Bitcoin hit the low end of this channel at $58,000, and just as the charts signaled, it has bounced back to $64,000. Based on the parallel channel, Bitcoin could push up as high as $70,000, the upper trend line of the parallel channel.
Investors should continue to expect movement inside the channel, meaning pullbacks off the high end and bounces off the low end, until it finally breaks.
Based on history of these patterns, generally a higher percentage of these patterns break to the upside vs downside.
The bias in the near-term is chop, the longer-term bias remains upside.